At Intervall I prototyped a low resolution LED display that makes coffee recipes accessible during brewing and uses live weight data from a bluetooth coffee scale to help me and my colleagues always match the recipe.
We drink a lot of coffee and try out various coffee roasts.
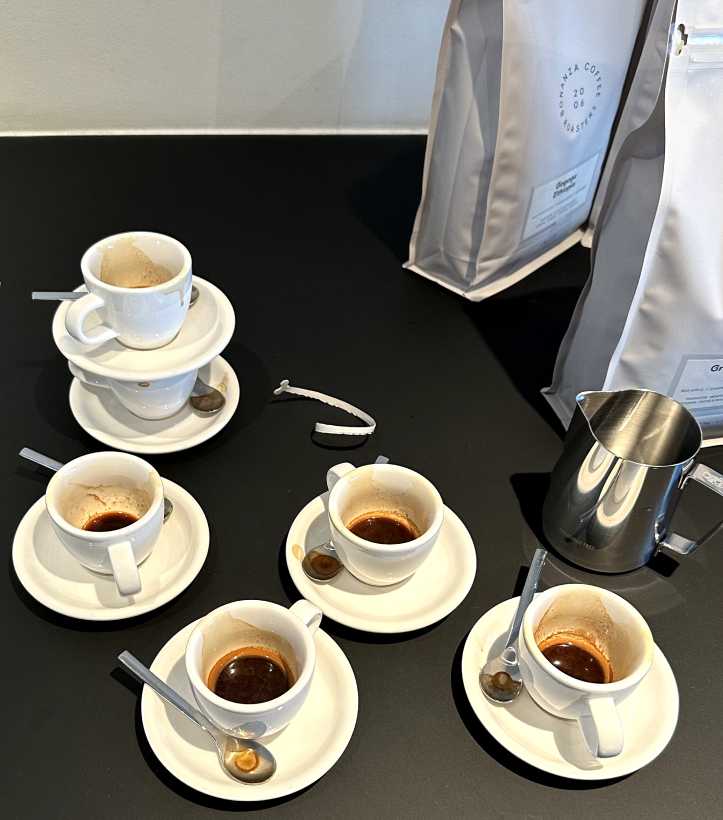
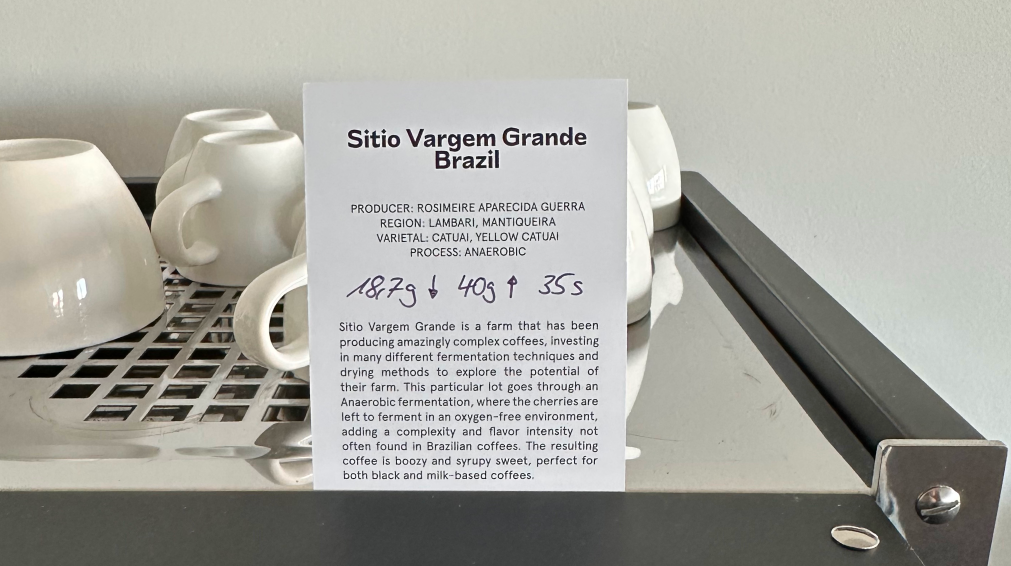
At the Intervall Office me and my colleagues try out various roasts from different roasters every month. Every coffee roast is unique and in order to get the most out of every roast we do an initial tasting round: This involves brewing several cups of coffee with different settings in our equipment until we like the taste of the coffee.
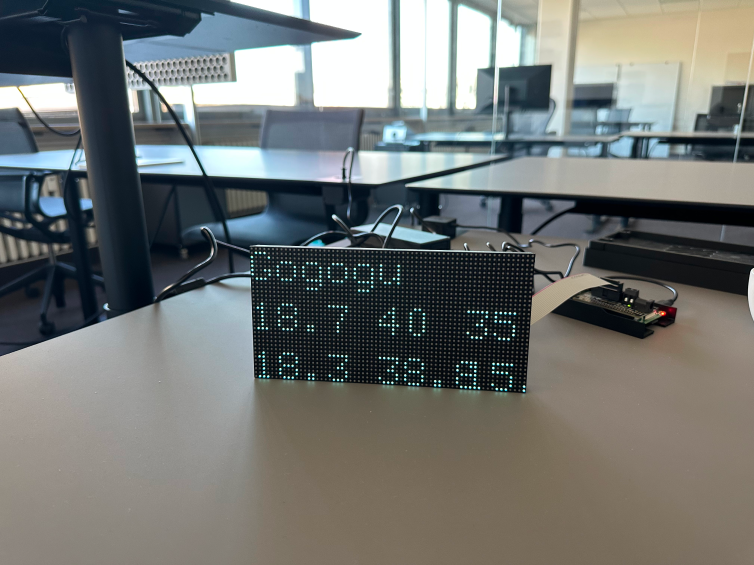
Every Coffee Roast has a Unique Recipe.
A coffee roasts recipe is defined in the initial tasting round and aims to make the taste of a roast reproducible. It consists of four core parameters: Grind level, bean weight, brewing weight and extraction time. The value of these parameters are not only dependent on the roast itself but also on the specific setup we use in our office.
| Coffee Roast | Grind Level | Bean Weight | Brewing Weight | Extraction Time |
|---|---|---|---|---|
| Gogogu | 0.8 | 18.7g | 40g | 35s |
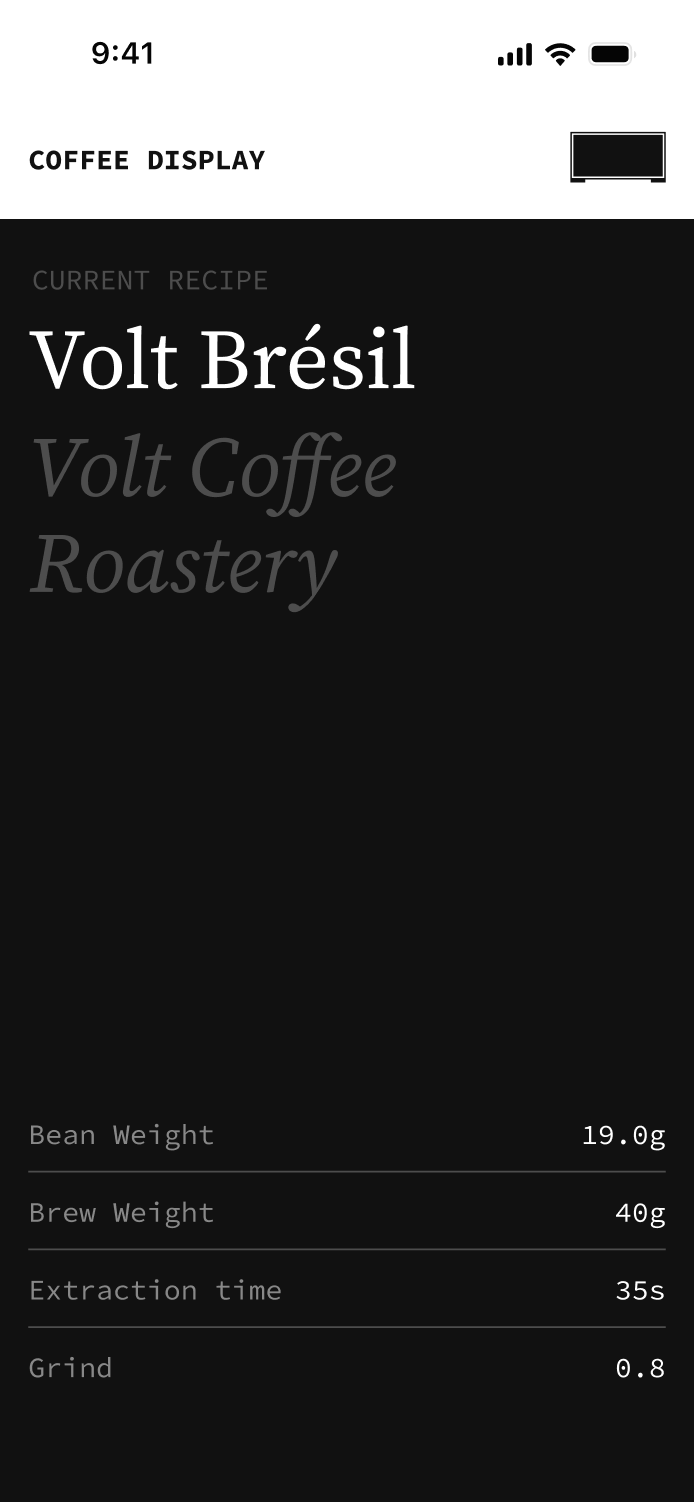
| Brésil | 0.6 | 19.0g | 38g | 39s |
| Katana | 1.0 | 19.0g | 35g | 26s |
How can we easily access all of our recipes?
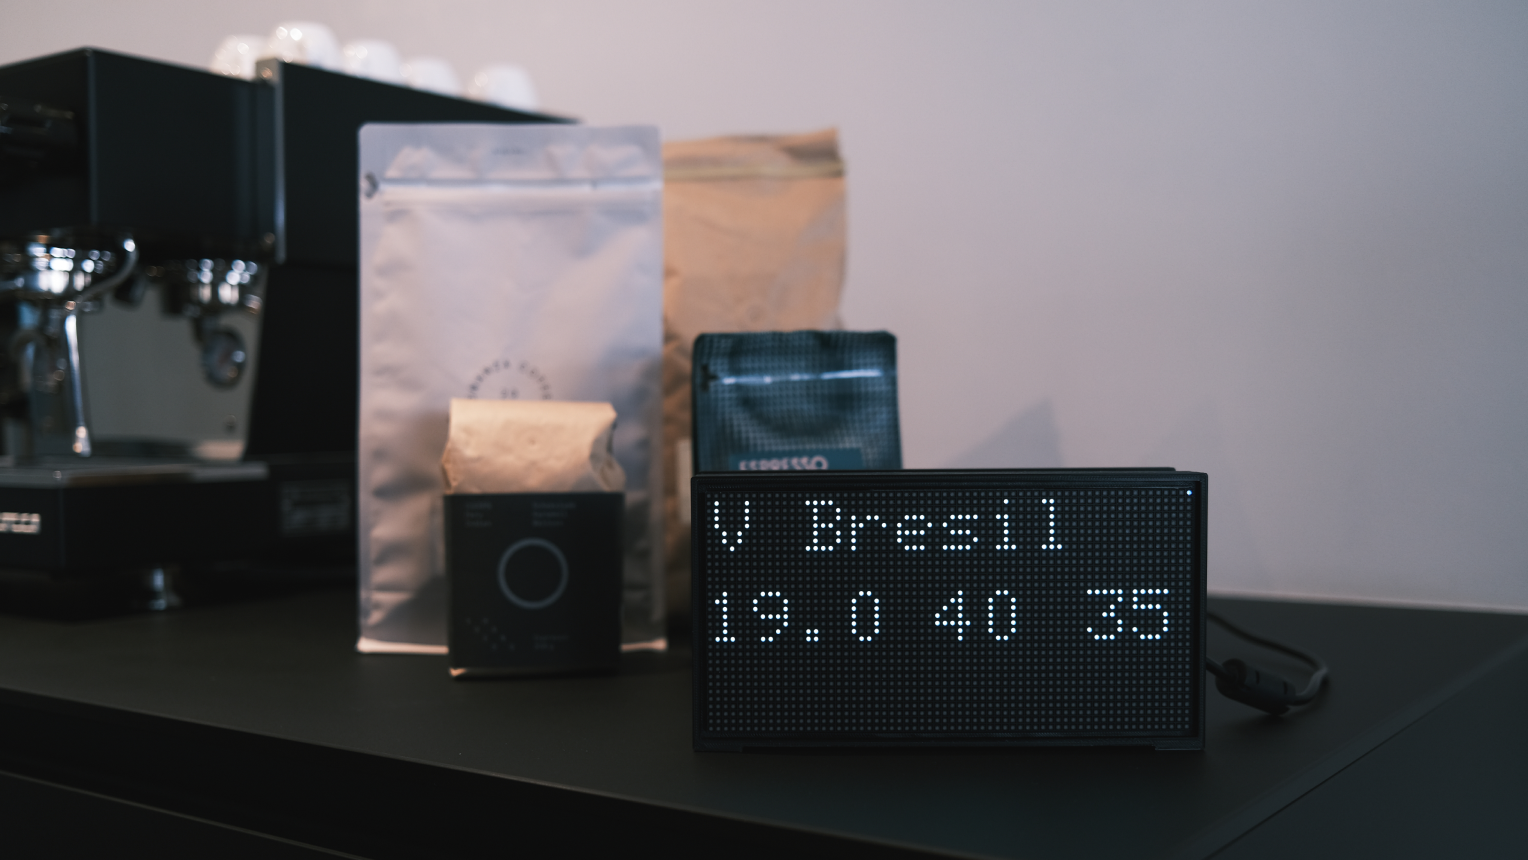
Coffee Display Makes all Recipes Accessible.
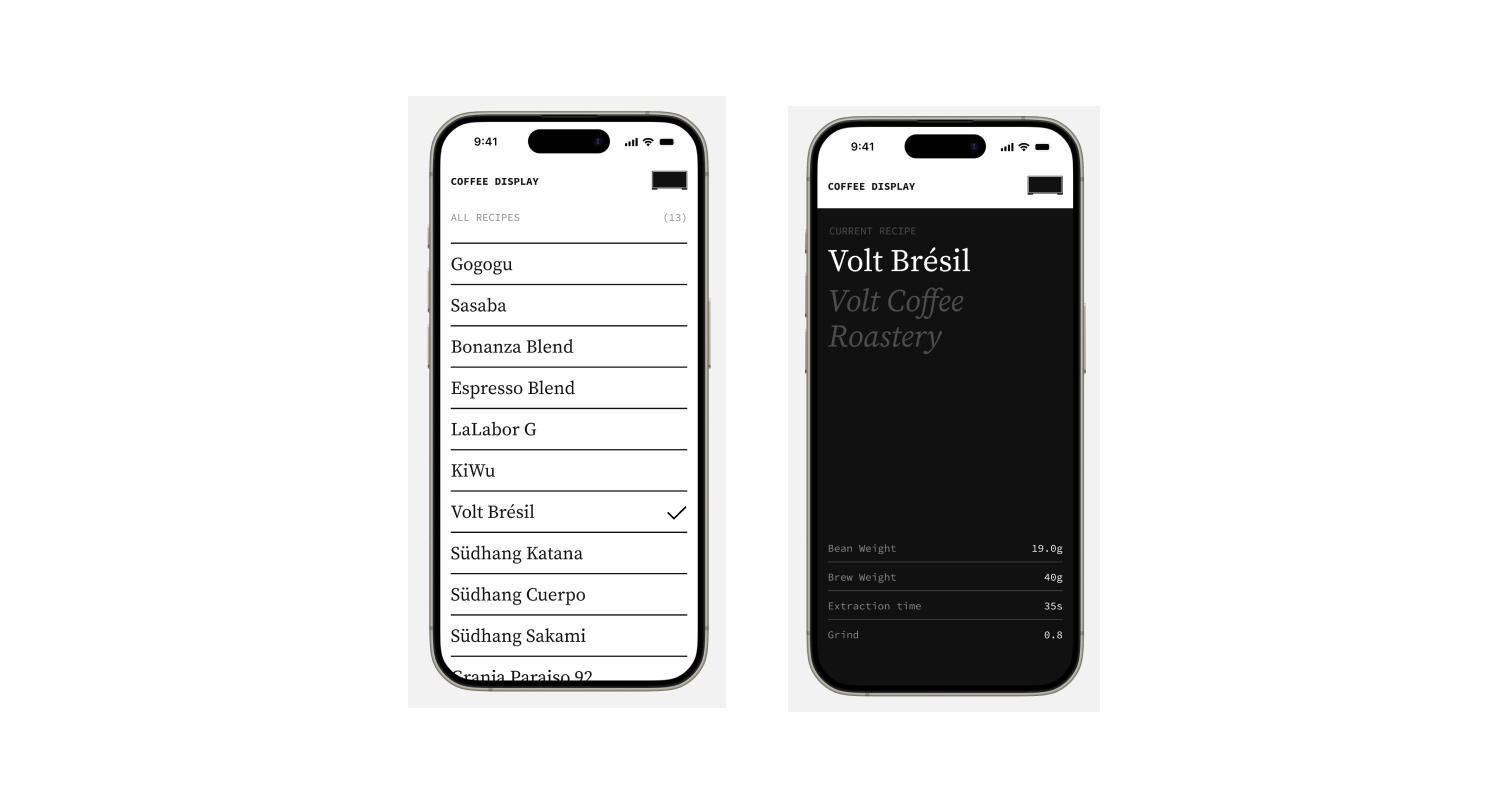
Stores All Coffee Recipes in One Place.

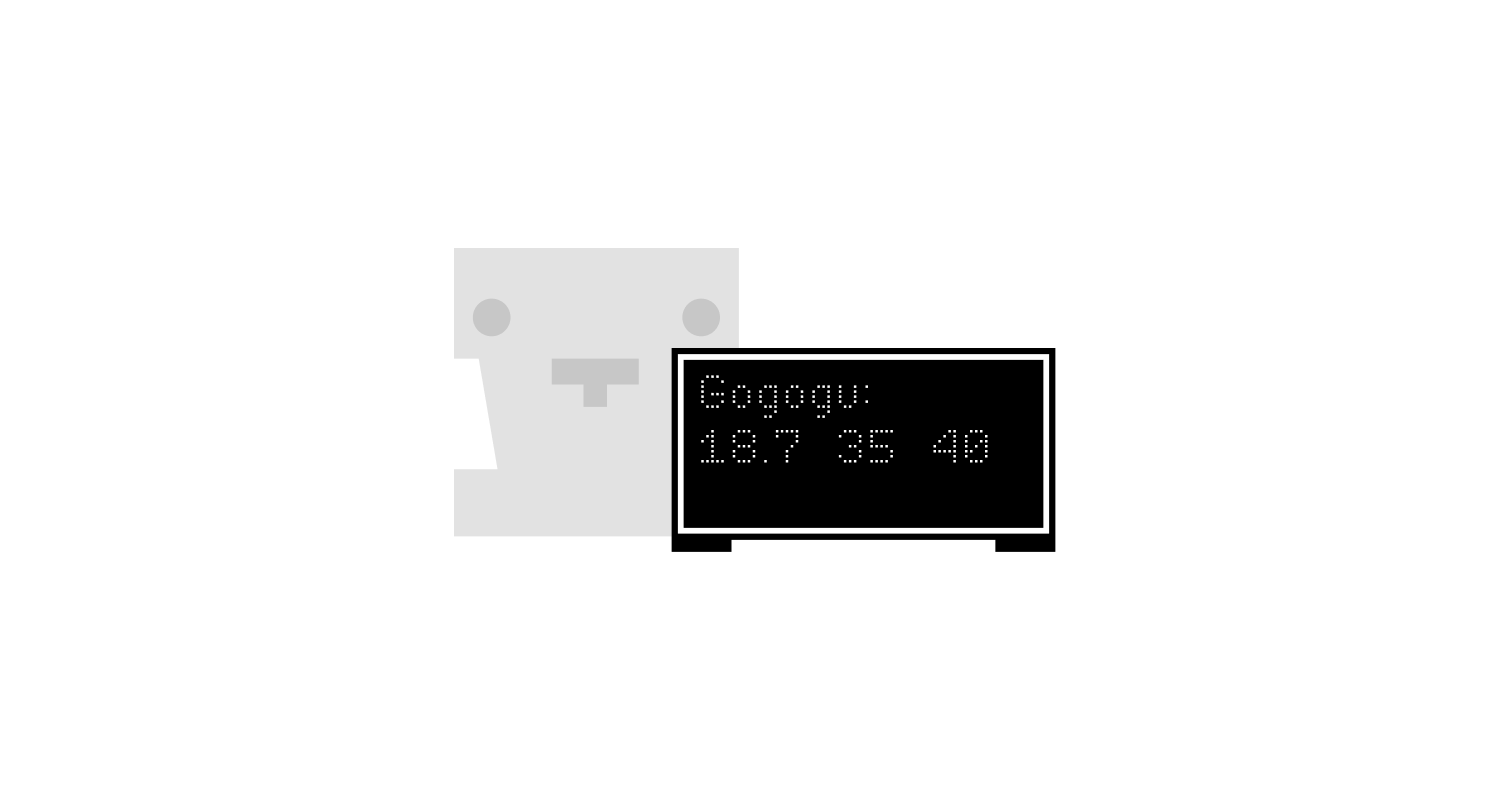
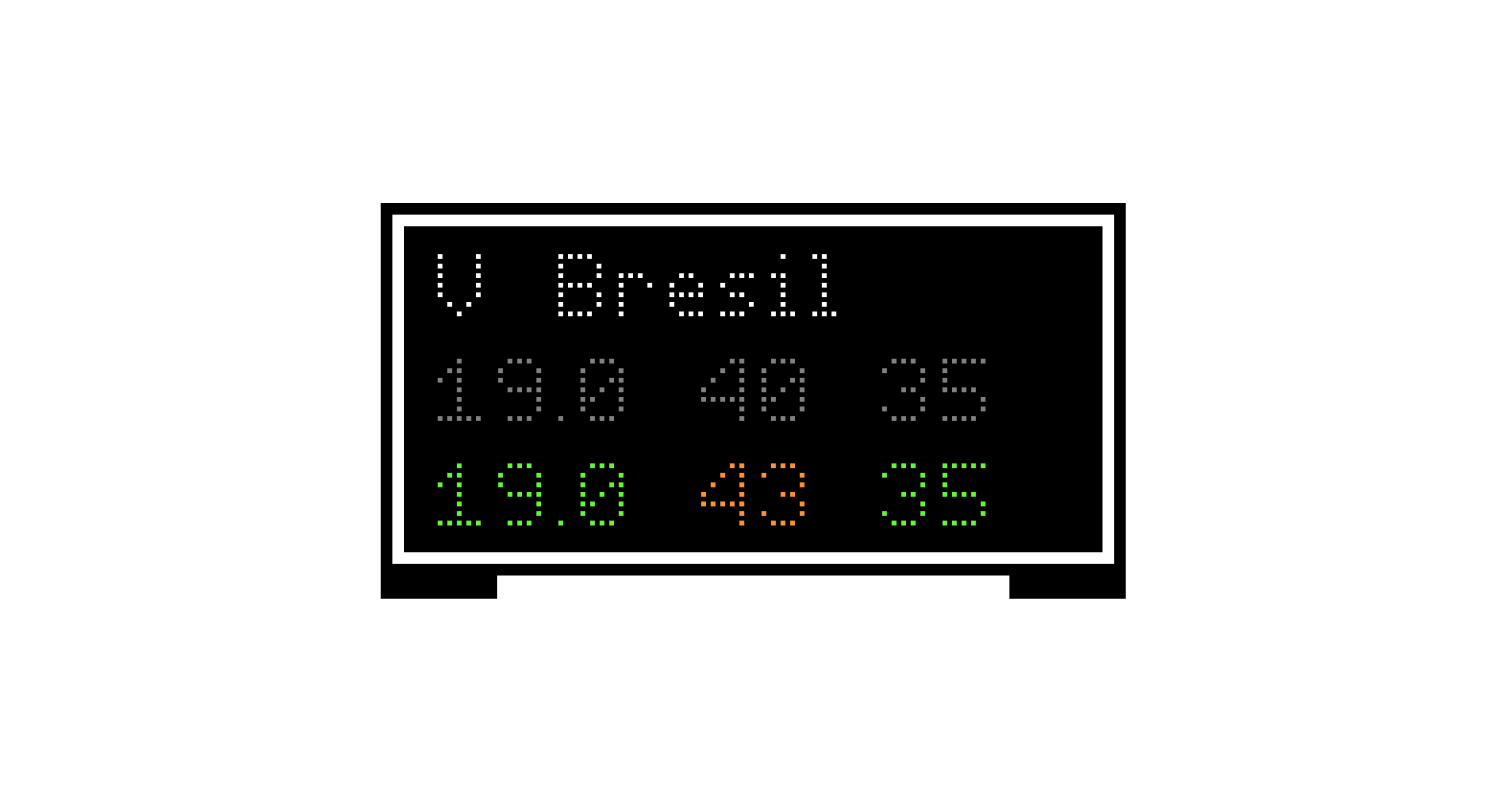
Shows the Essential Recipe Parameters.
Coffee Display Assists during Brewing.
Connects to Bluetooth Coffee Scales.

Compares Live Data with Recipe Parameters.
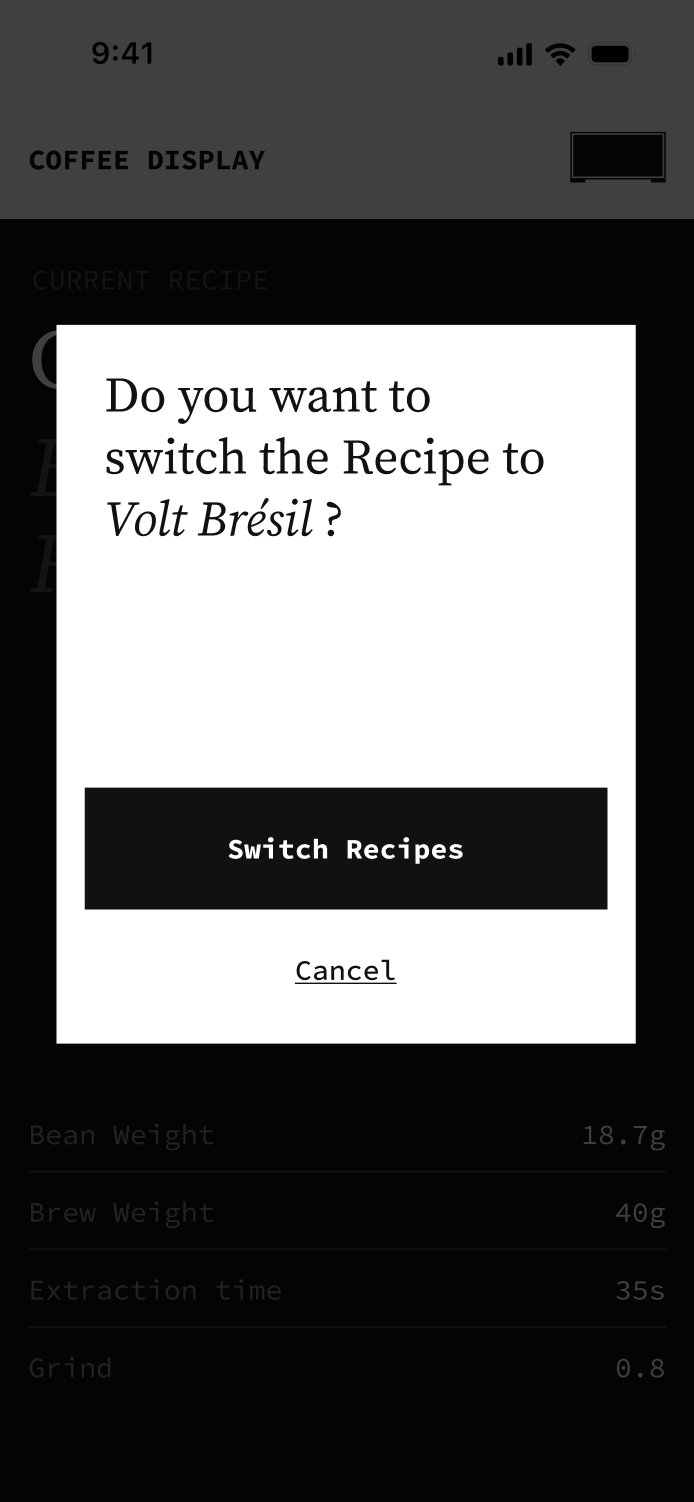
Coffee Display can be controlled Remotely.
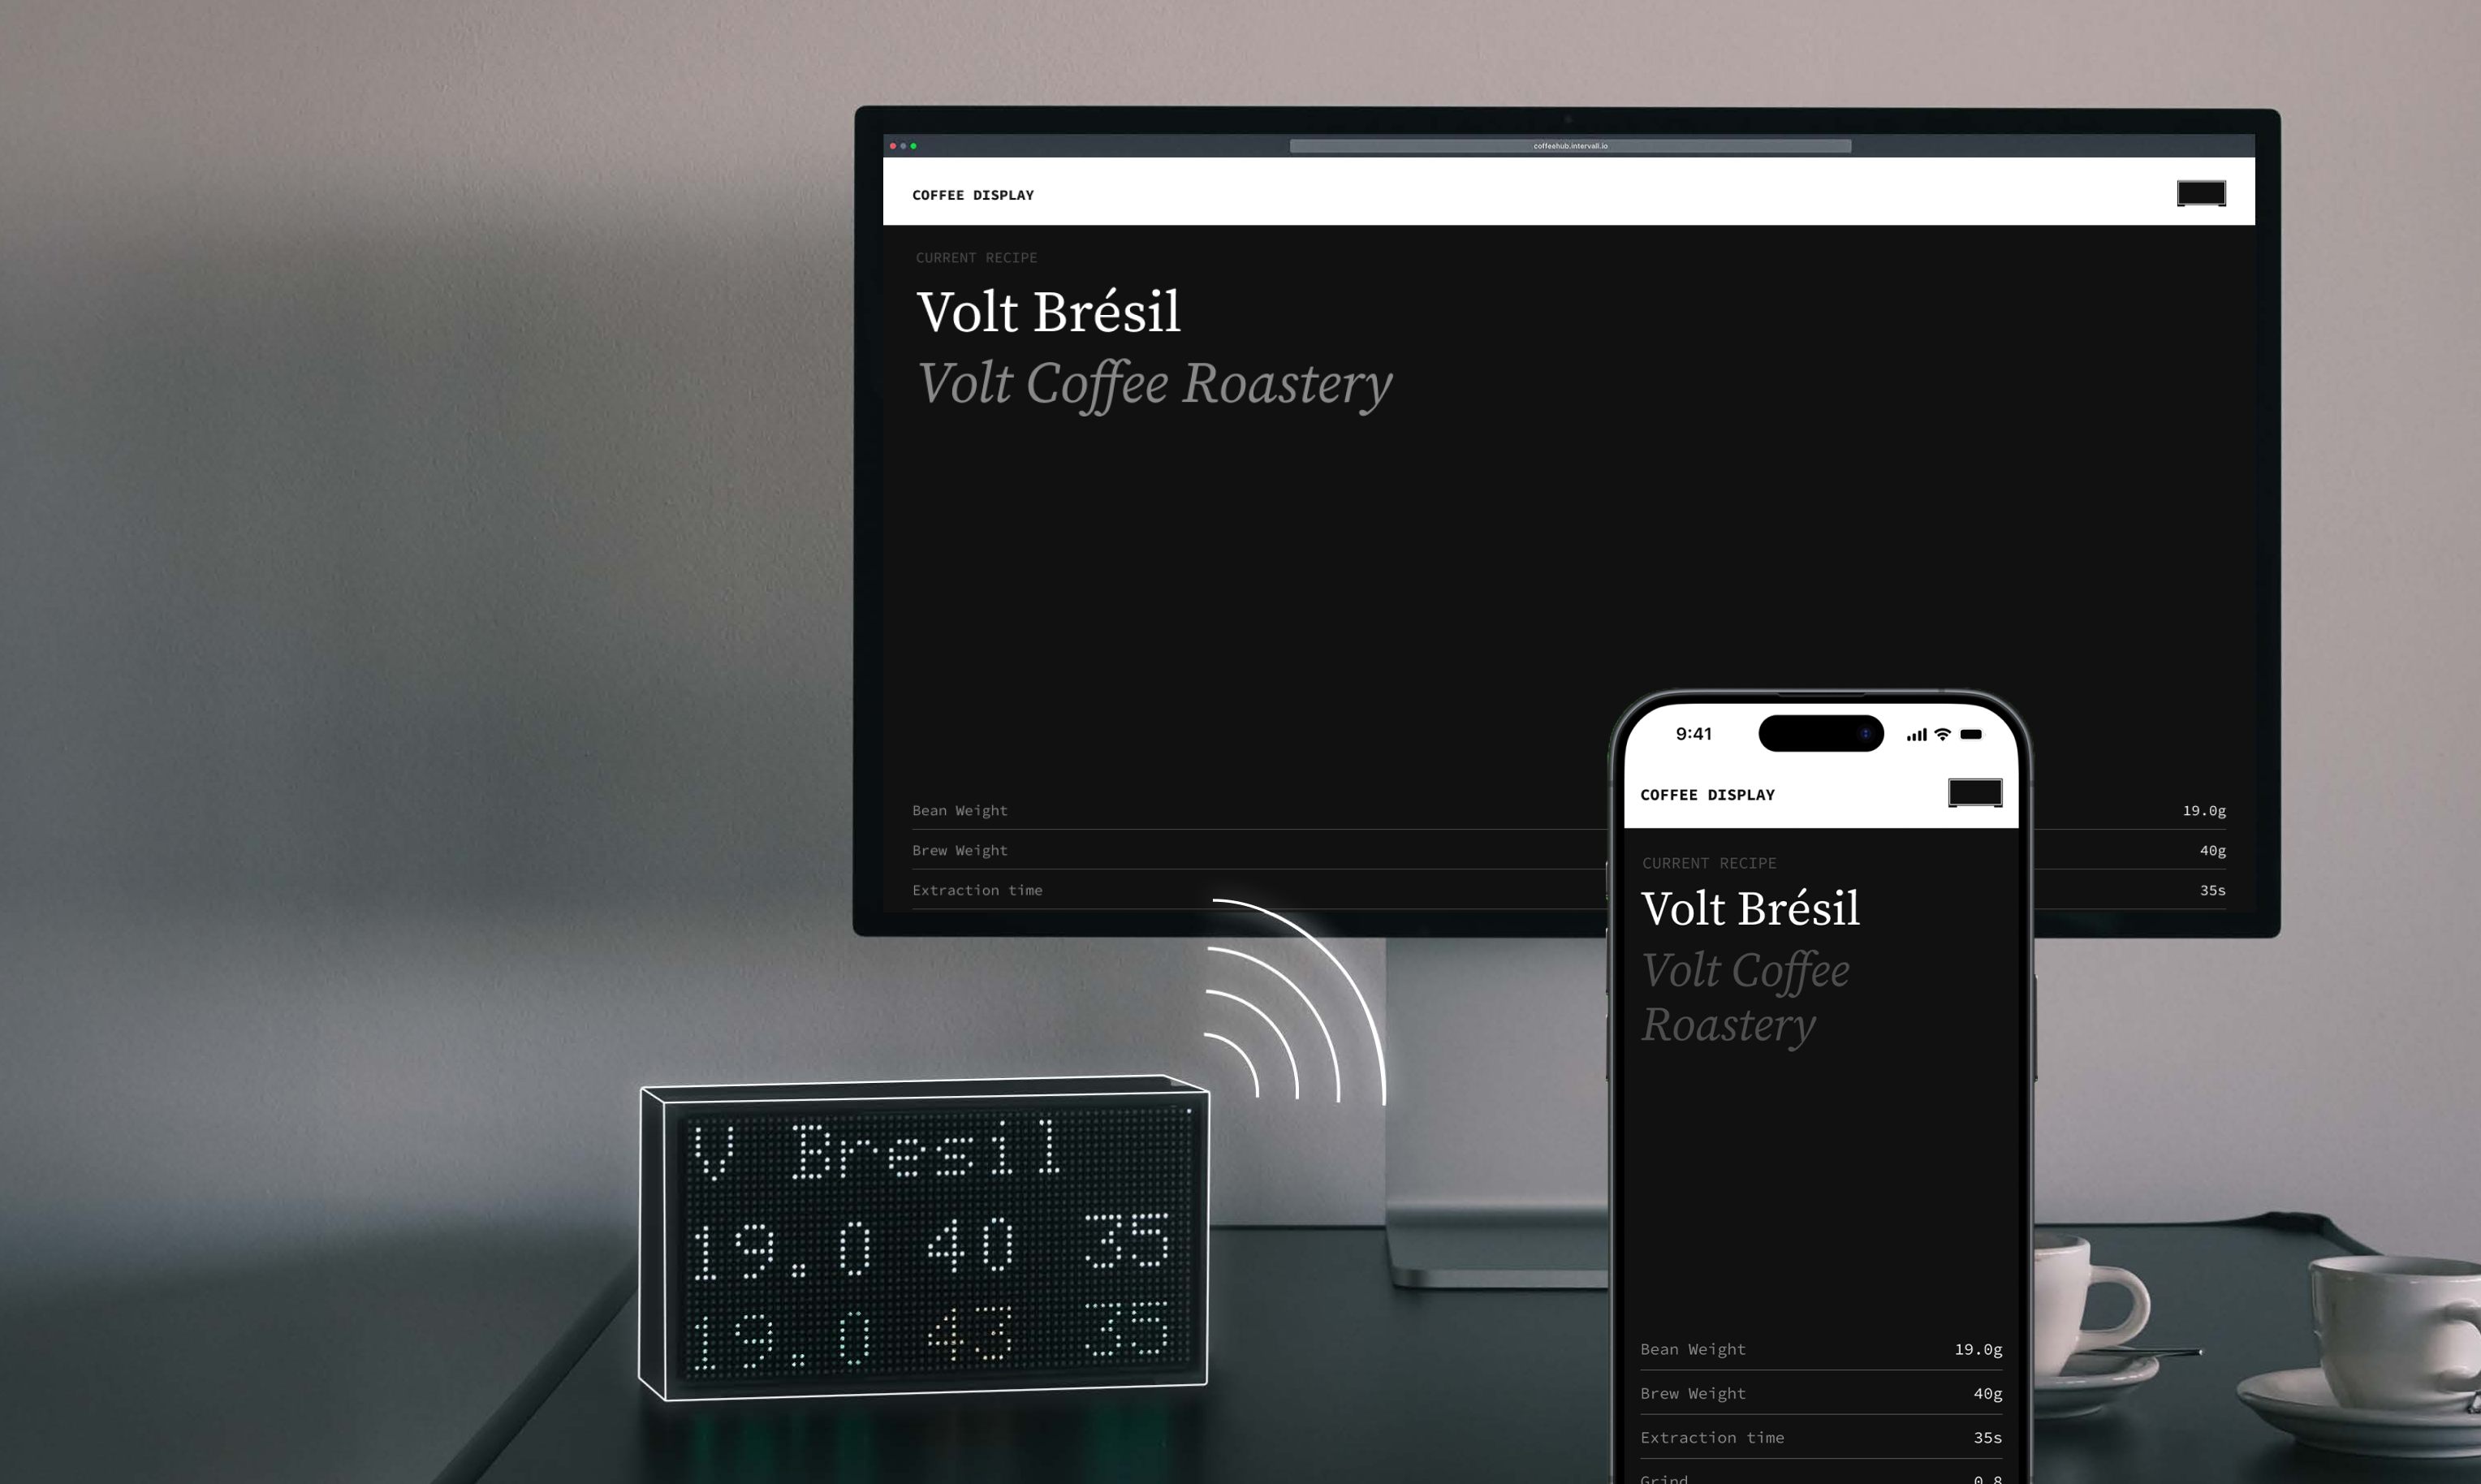
Hosts a browser based interface that can be accessed from any device in the same network.

Allows to select which recipe should be shown on the Display.
Coffee Display Enhances Every Step of Coffee Making.
Making coffee with an espresso machine usually consists of four steps: Weighing the beans, grinding the beans, preparing the portafilter basket and brewing the coffee. Coffee Display is a hands free assistant, running in the background. No manual interaction needed, letting the barista focus on the craftsmanship of making coffee.
[1] Weighing Coffee Beans
[1.1]
In idle mode Coffee Display shows the current recipe.

[1.2]
As soon as an object is placed on the scale, the weight is analyzed to detect the kind of
object. If the object is the dosing jar, the display switches to weighing mode and tares the scale.

[2] Grinding Coffee Beans
[2.1]
In weighing mode the scales measures the weight of the beans filled into the dosing. The
current weight is shown on the display.

[2.2]
Once the barista has filled in all the beans and removes the dosing jar with the beans for
grinding, the Coffee Display waits for 20 seconds before logging in the last measured weight. If the
barista only removes the jar for a few seconds, e.g to remove any excess beans, the weight will not be
logged in. Color coding indicates if the actual value is within range of the recipe.

[3] Preparing the Portafilter Basket
[3.1]
The barista fills the ground beans into the portafilter basket, distributes it equally and
tampers it. During this step, no scale is needed, so there is no object placed on it.

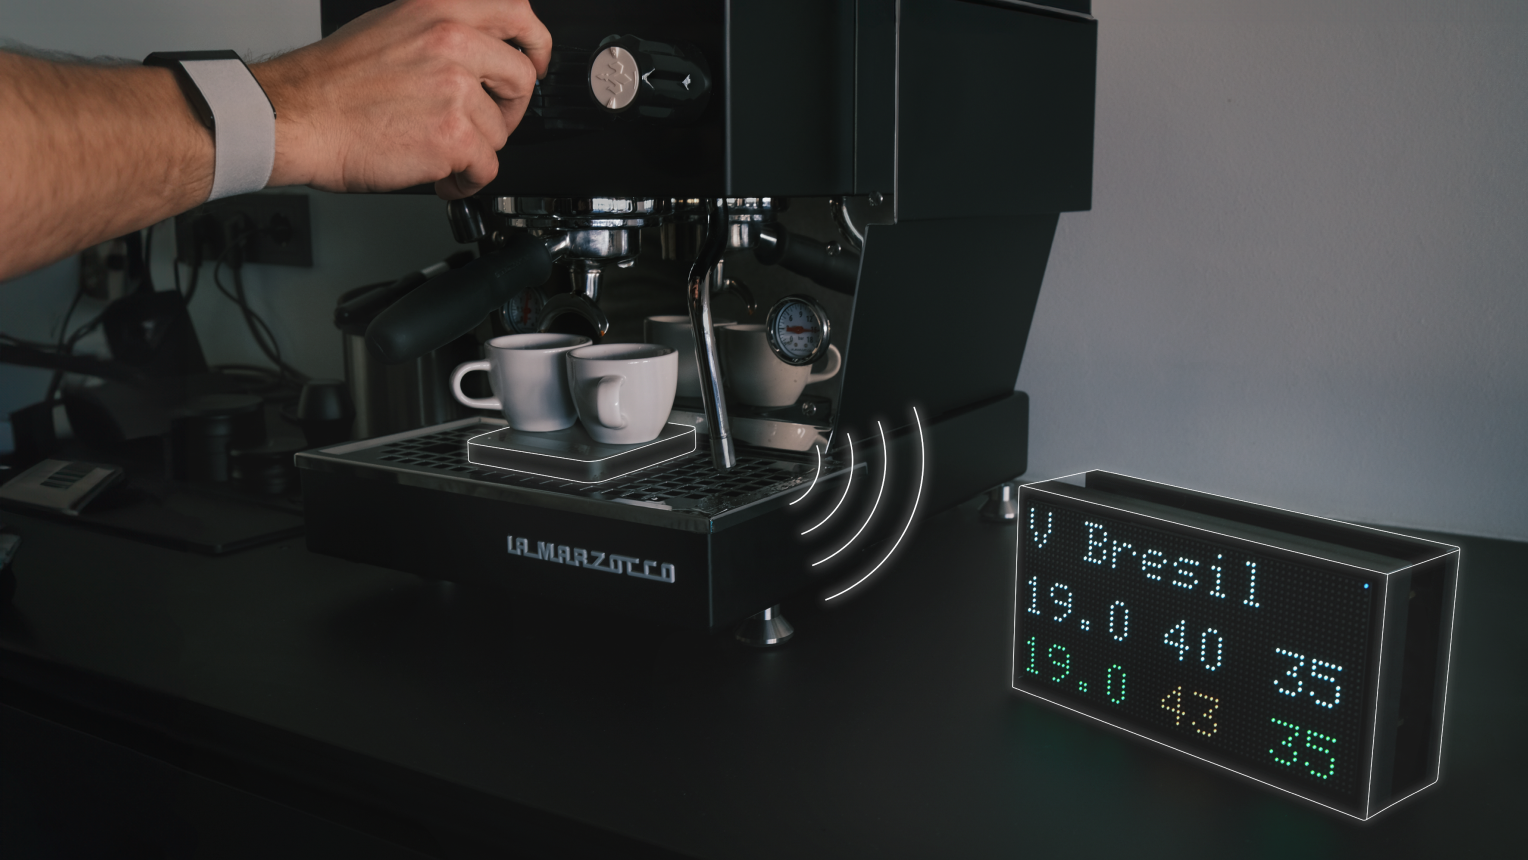
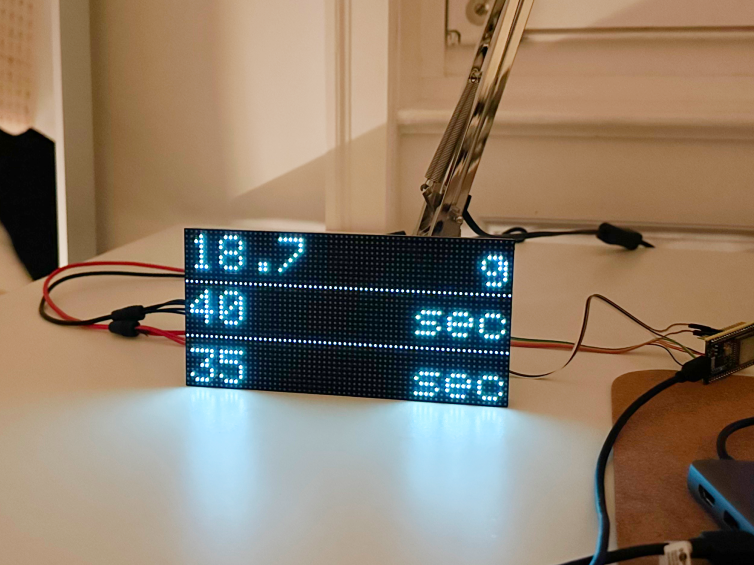
[4] Brewing Coffee
[4.1]
The barista mounts the portafilter basket in the espresso machine, puts the scale under the
outlet and places any type of coffee cup on the scale. The weight is analyzed to detect the kind of
object. If the object is a coffee vessel, the display switches to brewing mode, tares the scale and
starts the timer.

[4.2]
The scale beeps on tare and indicates the barista to start the brewing process by activating
the water flow. During brewing the display shows the live weight and timer value. The barista observes
the values and decides when to manually stop the brewing process – ideally this is the case if the
brewing weight and the extraction time value are within range of the target value.

[4.3]
Coffee Display detects if the weight changes are minimal, indicating the brewing process has
been ended. It then logs in the measured brewing weight and extraction time values. Color coding
indicates if the actual values are within range of the recipe.

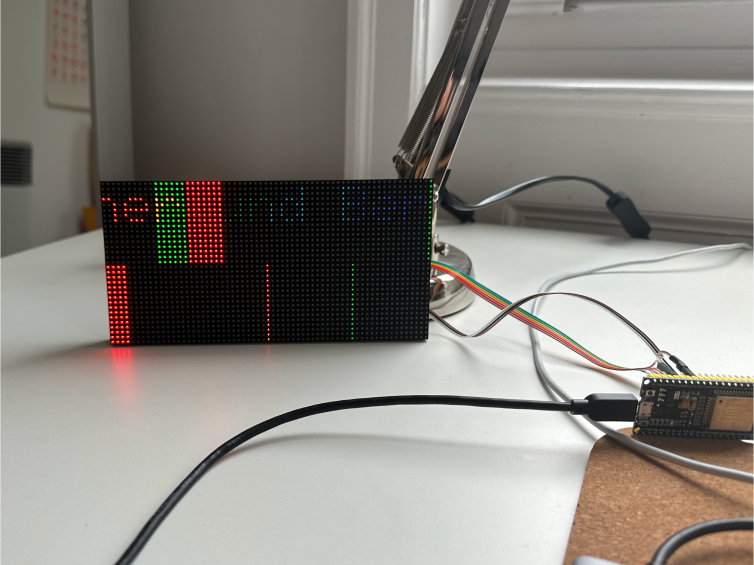
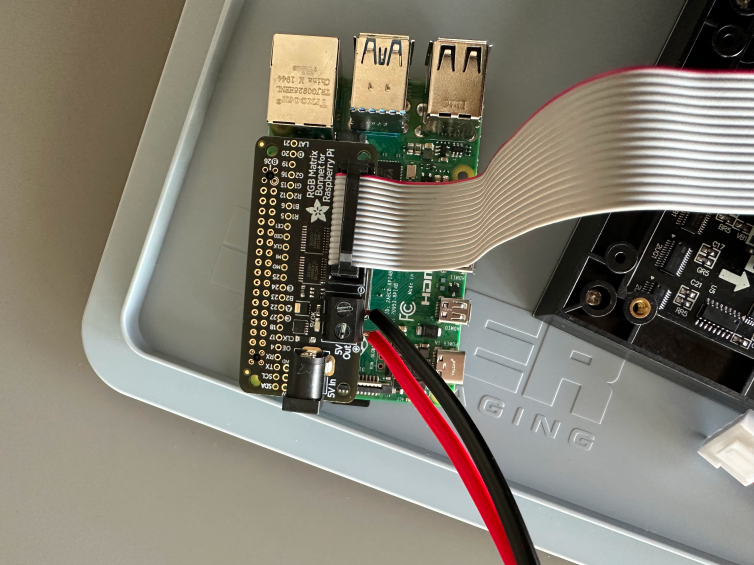
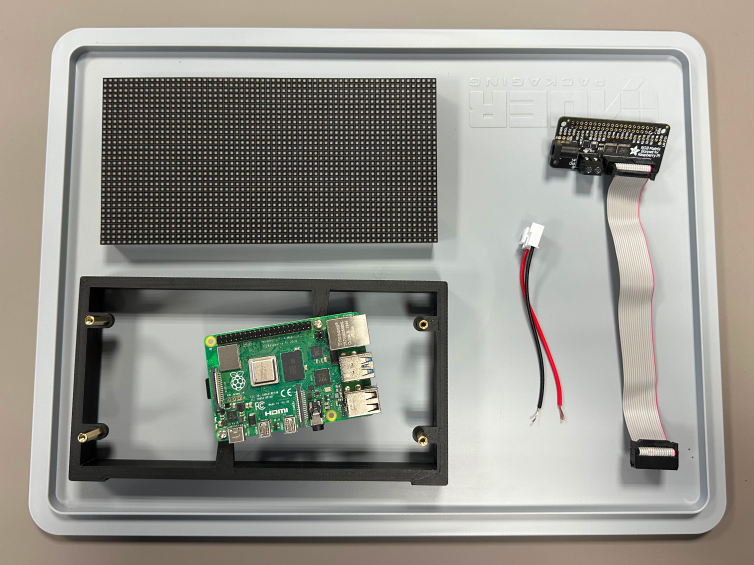
Building the Hardware.
Initially I only wanted to use the LED matrix to display the current recipe. So for the first prototype a ESP32 microcontroller was sufficient to address the LED matrix. After a successful test the idea arose that I could connect the display to a bluetooth scale and readout its data. As this would require more computing power to analyze the weight data, I switched from the microcontroller to a Raspberry Pi 4. I used a GPIO Hat to connect the Pi to the LED matrix and supply both devices with power. Finally I enclosed everything in a 3D printed housing, using the design from KNIFA.
First Prototype using an ESP32 Microcontroller.
Switching to Raspberry Pi.
Combining all Parts in a 3D Printed Housing.
Writing the Code.
For the first prototype using the microcontroller I used a C library to address the matrix. When
switching to Raspberry Pi I did initial tests using Rust to handle the bluetooth communication to the
coffee scale. Later I switched to Python, as there were more libraries available and I already had more
experience in this language.
For the bluetooth communication to our coffee scale (Acaia Lunar) I used a library from Luca Pinello
which was a great basis. I wrote a main script that constantly analyses the weight data from the scale
to detect different vessels placed on the scale which triggers the switch into the according operating
mode. This script also controls the display to show the information based on the mode. It also reads out
the JSON file containing the recipes and logs the data from each brewing session into a CSV. The main
script is run by a shell script which is called each time the Pi is booted.
Dosing Vessel

Coffee Vessels

Designing and Implementing the Web Interface.
Up to this point it was only possible to select the active recipe through the command line or setting a
variable within the script. To make this more convenient – as I'm an interaction designer after all – I
wanted to make this more user friendly.
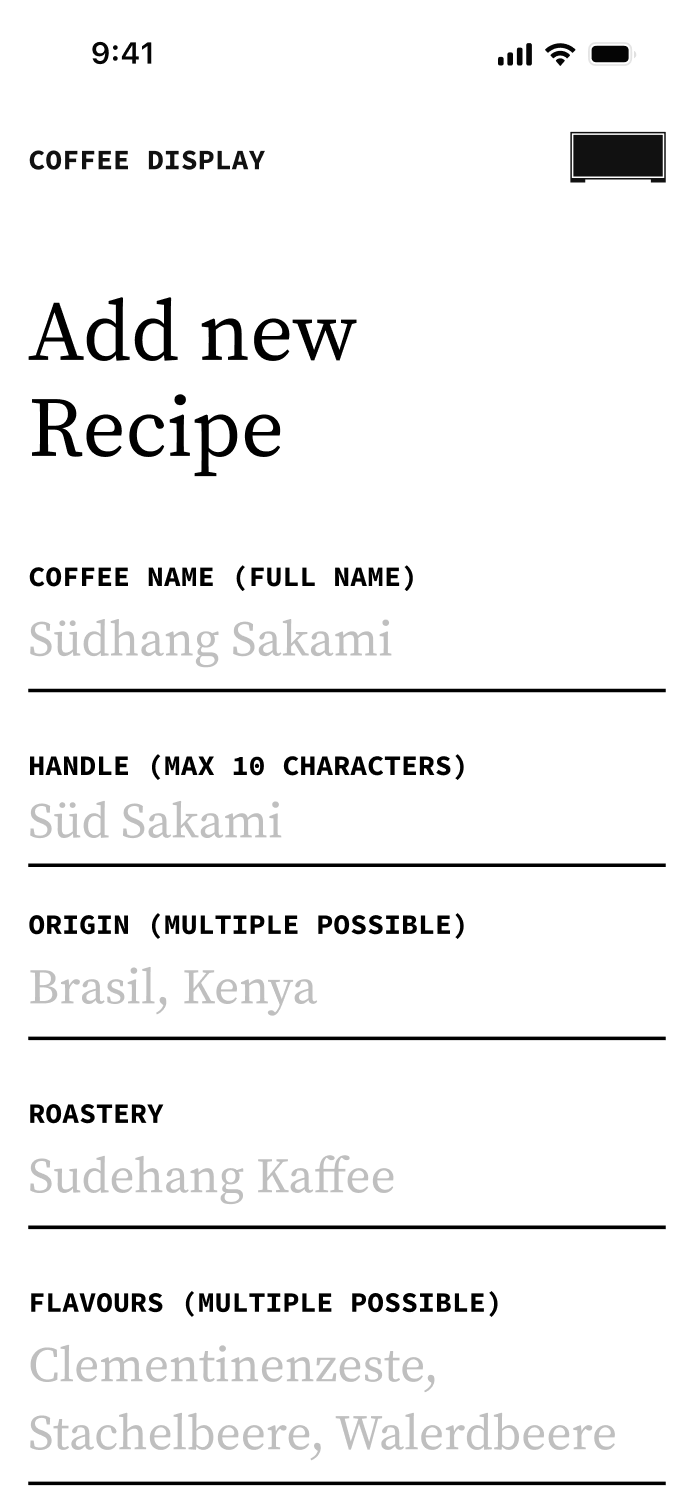
I setup a flask server hosting a website on the local network, which reads out the JSON containing all
recipes and the selected recipe – the same database the main script is using. Users can see all details
of the selected recipe, a list of all recipes from which they can choose one to switch to. They can also
add new recipes through a form and edit existing ones. To run the main script and server simultaneously
and allow communication between the two I added a higher level script.